The Denver Real Estate Market in 3 Charts
Average Price
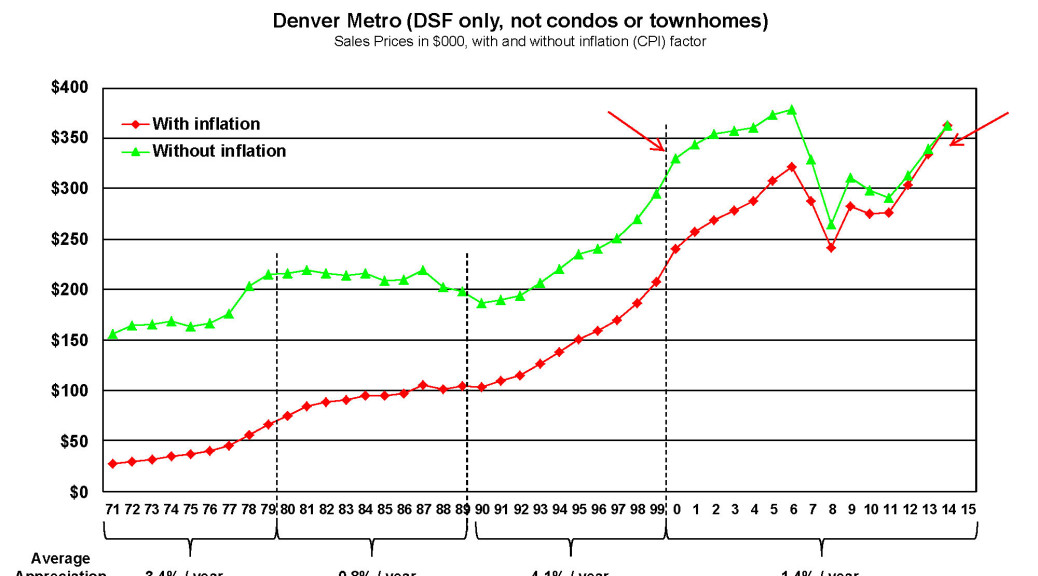
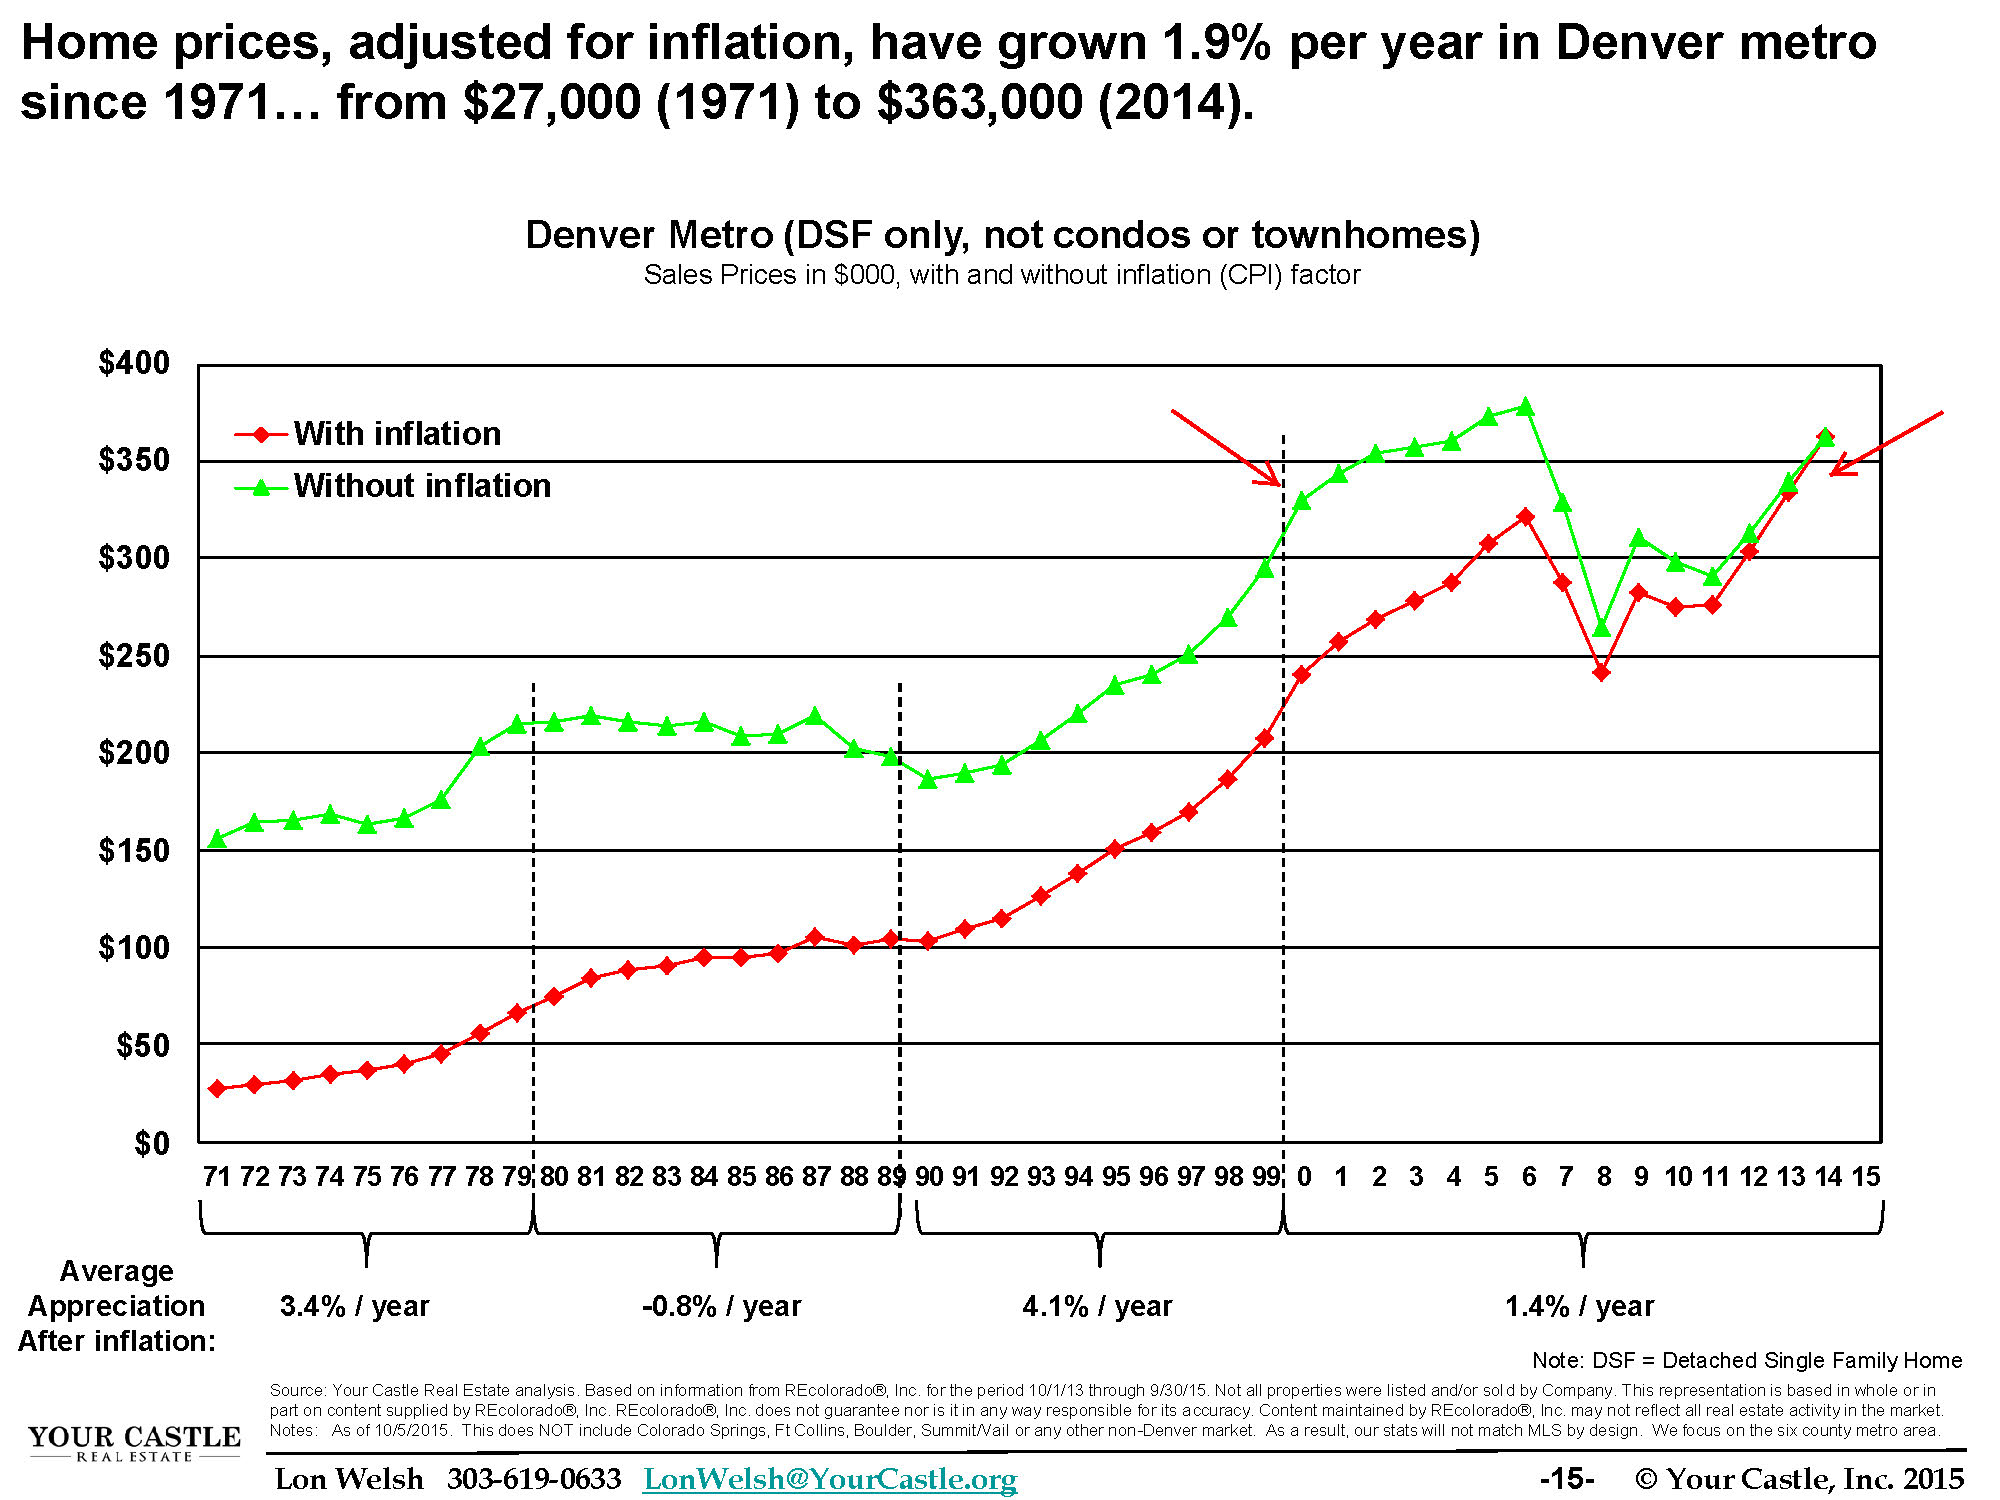
The chart below shows the average Denver metro area home price, from 1971 to 2014. Notice that if you take inflation out of the equation THERE HAS BEEN ALMOST NO PRICE CHANGE IN DENVER SINCE 2000!! You can also look at the green line as “today’s dollars”.
So, the price hasn’t changed, income has gone up and rates have gotten lower. We are not in an inflated market. Prices are right where they should be, or even on the low side.
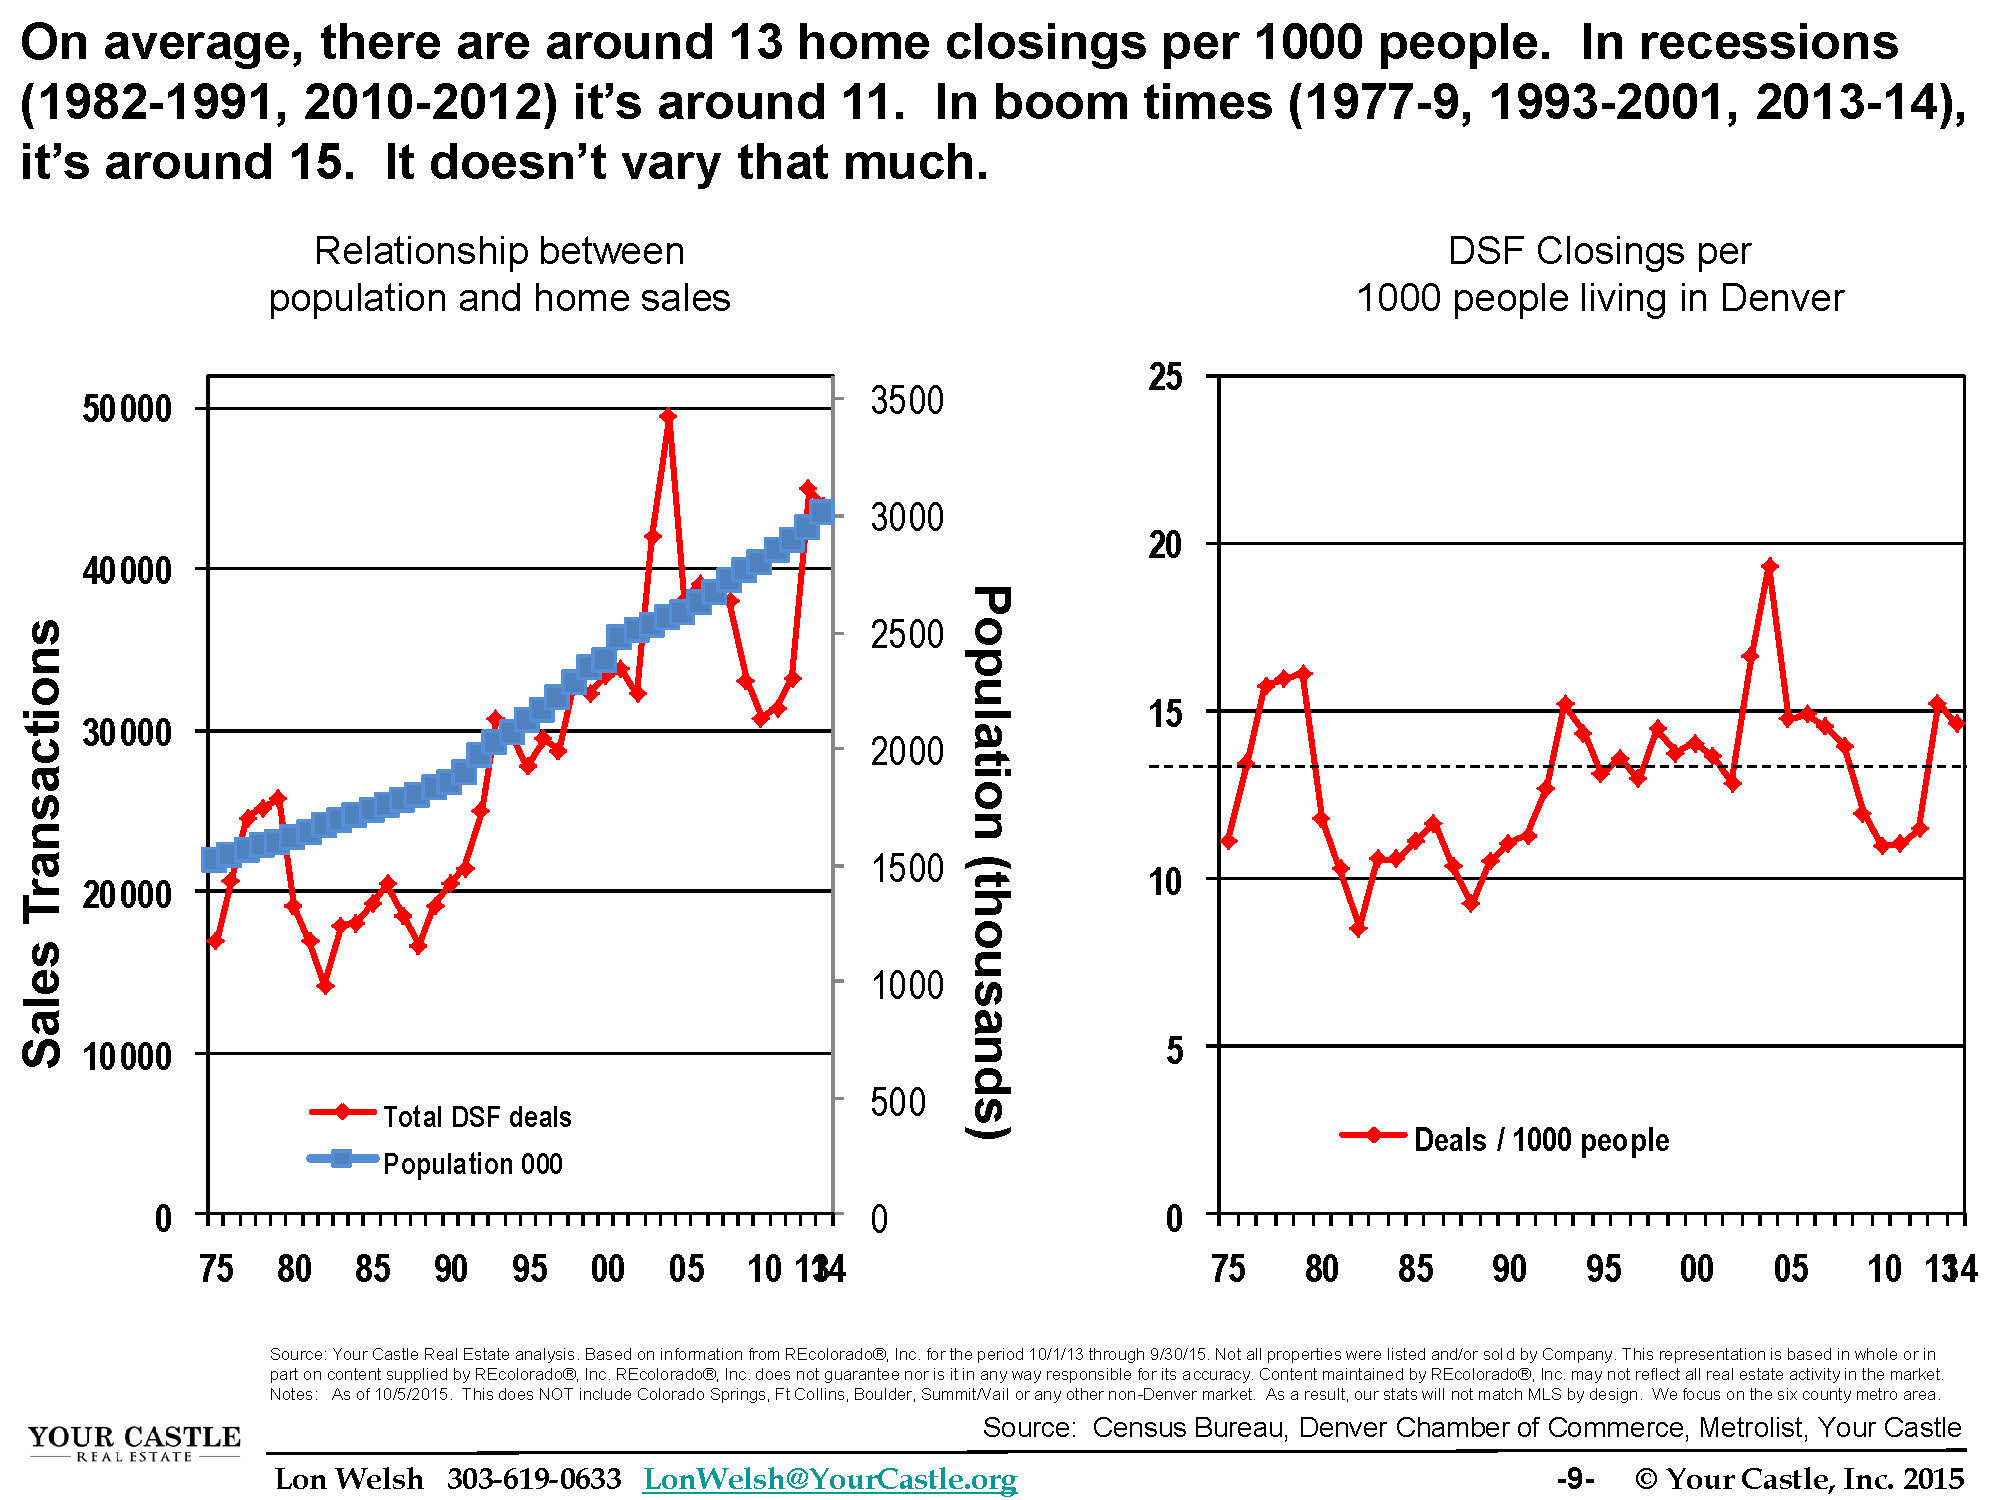
Relationship Between Population and Home Sales
Based on 45 years of history, we should expect 13 closings per 1,000 people living in the Denver metro area. Today we’re closing just about that number.
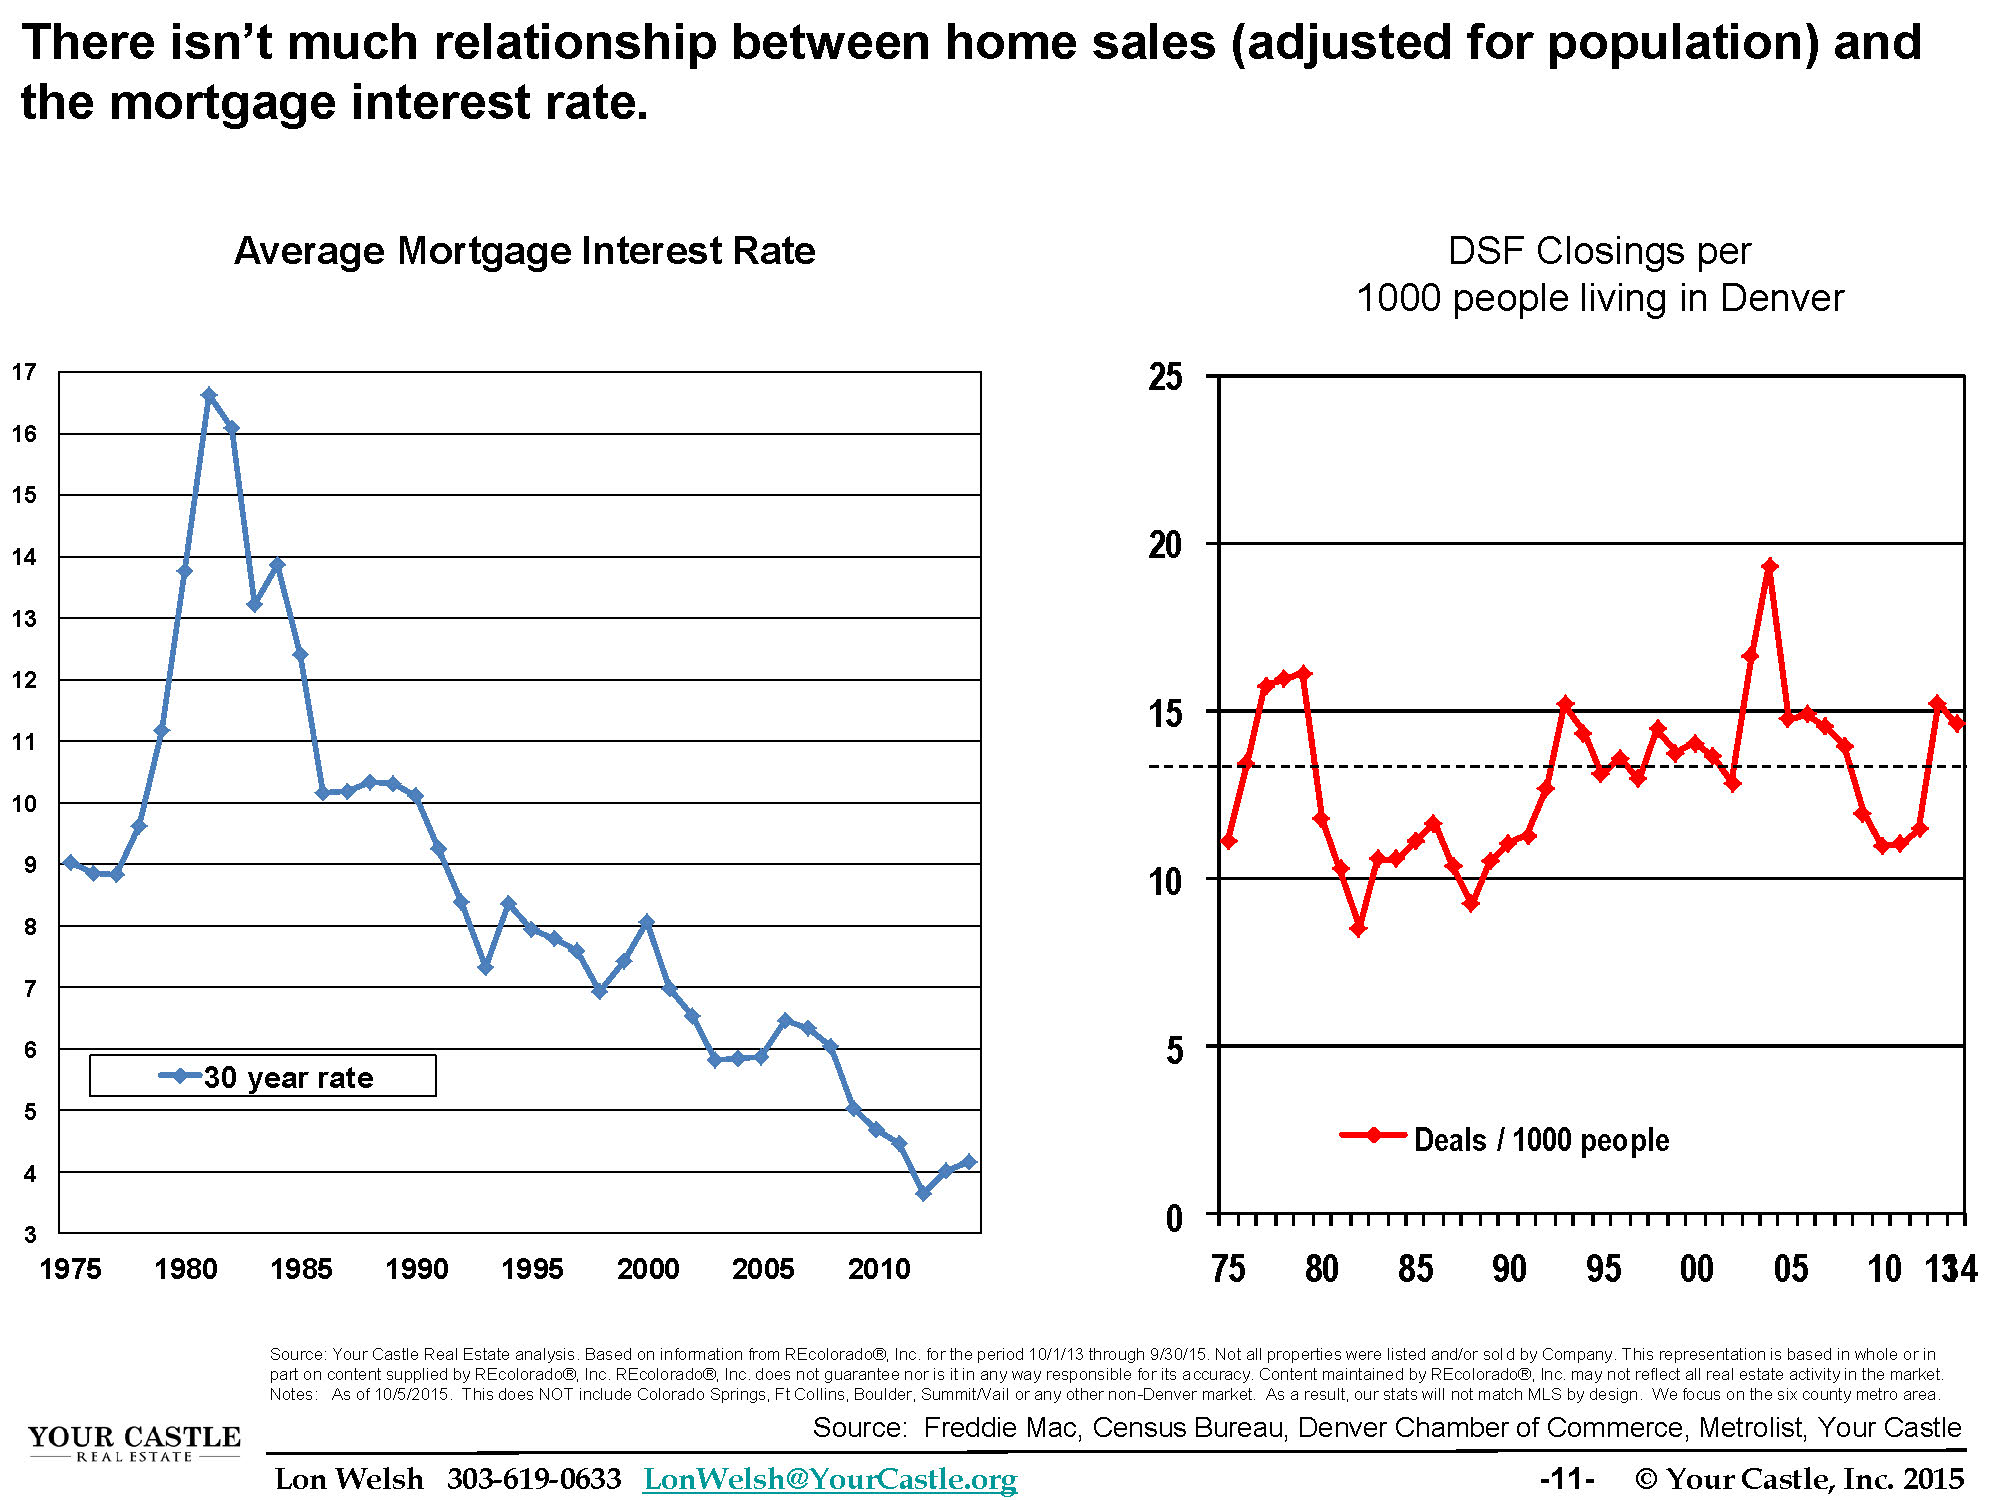
Relationship Between Interest Rate and Home Sales
The chart below shows the relationship (or lack thereof) between home sales (adjusted for population) and the mortgage interest rate. If you take out 1979-1990, when rates were over 10%, there is NO RELATIONSHIP between home sales volume in Denver and interest rates. Interests rates do affect affordability, but they don’t affect sales volume.
So, what does that mean for you?
Buy when you’re ready to buy.
Sell when you’re ready to sell.
Don’t play the interest rate game; you’re better off going to Vegas and betting on black.